Debug Script
CKB-Debugger
ckb-debugger is a standalone debugger CLI tool enabling off-chain contract development.
Install
cargo install --git https://github.com/nervosnetwork/ckb-standalone-debugger ckb-debugger
Usage
ckb-debugger 0.113.0

USAGE:
    ckb-debugger [FLAGS] [OPTIONS] --mode <mode> --tx-file <tx-file> [args]...

FLAGS:
    -h, --help       Prints help information
        --prompt     Set to true to prompt for stdin input before executing
        --step       Set to true to enable step mode, where we print PC address for each instruction
    -V, --version    Prints version information

OPTIONS:
        --bin <bin>                                File used to replace the binary denoted in the script
    -i, --cell-index <cell-index>                  Index of cell to run
    -t, --cell-type <cell-type>                    Type of cell to run [possible values: input, output]
        --decode <decode>                          Decode RISC-V instruction
        --dump-file <dump-file>                    Dump file name
        --gdb-listen <gdb-listen>                  Address to listen for GDB remote debugging server
        --gdb-specify-depth <gdb-specify-depth>    Specifies the depth of the exec/spawn stack [default: 0]
        --max-cycles <max-cycles>                  Max cycles [default: 70000000]
        --mode <mode>
            Execution mode of debugger [default: full]  [possible values: full, fast, gdb, probe, gdb_gdbstub]

        --pprof <pprof>                            Performance profiling, specify output file for further use
        --read-file <read-file>
            Read content from local file or stdin. Then feed the content to syscall in scripts

    -s, --script-group-type <script-group-type>    Script group type [possible values: lock, type]
        --script-hash <script-hash>                Script hash
        --script-version <script-version>          Script version [default: 2]
        --skip-end <skip-end>                      End address to skip printing debug info
        --skip-start <skip-start>                  Start address to skip printing debug info
    -f, --tx-file <tx-file>                        Filename containing JSON formatted transaction dump

ARGS:
    <args>...
Examples
1. Execute Transactions Locally
We can download a on-chain transaction from the network and execute it locally. To download a transaction, use ckb-cli:
$ ckb-cli --url https://mainnet.ckbapp.dev/rpc mock-tx dump --tx-hash 0x5f0a4162622daa0e50b2cf8f49bc6ece22d1458d96fc12a094d6f074d6adbb55 --output-file mock_tx.json
You can execute the lock script or type script in the transaction:
$ ckb-debugger --tx-file mock_tx.json --cell-index 0 --cell-type input --script-group-type lock

Run result: 0
Total cycles consumed: 1697297(1.6M)
Transfer cycles: 12680(12.4K), running cycles: 1684617(1.6M)
The option --bin gives ckb-debugger a chance to "replace" the script, We try to replace the running code in the transaction above with a new version of the lock.
// always_failure.c
int main() {
    return 1;
}
$ ckb-debugger --tx-file mock_tx.json --cell-index 0 --cell-type input --script-group-type lock --bin always_failure

Run result: 1
Total cycles consumed: 1706(1.7K)
Transfer cycles: 764, running cycles: 942
2. Debug Failed Transactions
In most case, you want to debug failed transactions instead of successful one to find out the failed reasons.
First, let's dump the transaction into a local file. Assume that you are using Lumos SDK to build the transaction,
you can do this by converting the txSkeleton type into a json file:
> let txJson = rpc.paramsFormatter.toRawTransaction(lumos.helpers.createTransactionFromSkeleton(txSkeleton))
> fs.writeFileSync('failed-tx.json', JSON.stringify(txJson, null, 2))
Second, you will need ckb-transaction-dumper to convert the failed-tx.json to a dump transaction with its surrounding context info:
$ ckb-transaction-dumper -t failed-tx.json -o full-failed-tx.json -r <mainnet/testnet/devnet RPC url>
Now let's try debugging the Script, remember to replace the actual cell-type and cell-index in the following command:
$ ckb-debugger --tx-file full-failed-tx.json --cell-index 0 --cell-type output --script-group-type type
3. Debug Script with GDB
We can use ckb-debugger for debugging Script programs using GDB.
Assume the Script is a fib.c file:
int fib(int n) {
    if (n == 0 || n == 1) {
        return n;
    } else {
        return fib(n-1) + fib(n-2);
    }
}

int main() {
    if (fib(5) != 5) {
        return 1;
    }
    return 0;
}
After compiling the fib.c to riscv binary fib, we can debug this Script in GDB mode:
$ ckb-debugger --mode gdb --gdb-listen 127.0.0.1:9999 --bin fib
$ riscv64-unknown-elf-gdb fib

$ (gdb) target remote 127.0.0.1:9999
$ (gdb) b fib
$ (gdb) c
    Breakpoint 1, fib (n=5) at fib.c:2
At the Breakpoint 1, we learn that fib (n=5) at fib.c:2.
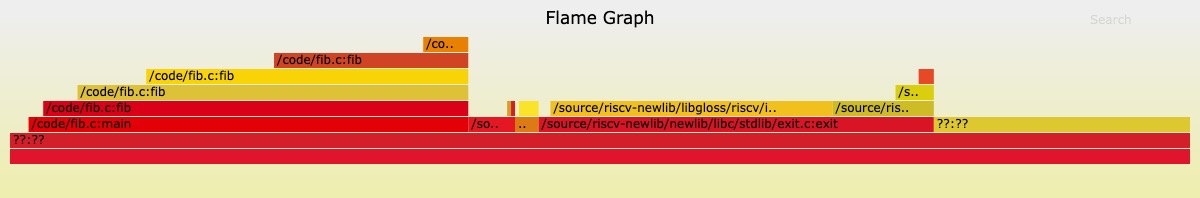
4. Profiling data With Flamegraph Visualization Tool
We can use ckb-debugger to profile data in the format expected by the flamegraph visualization tool.
$ ckb-debugger --bin fib --pprof fib.pprof
To convert the textual representation of a flamegraph to a visual one, first install inferno:
$ cargo install inferno
Then, pass the file created by ckb-debugger into inferno-flamegraph:
$ cat fib.pprof | inferno-flamegraph > fib.svg
Open the svg: